Debugging the Application
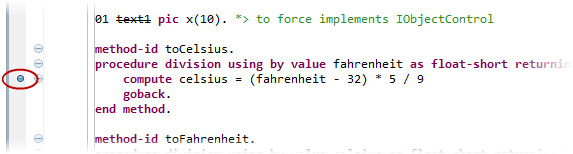
- Set a breakpoint in the JVM COBOL code: The breakpoint is set.
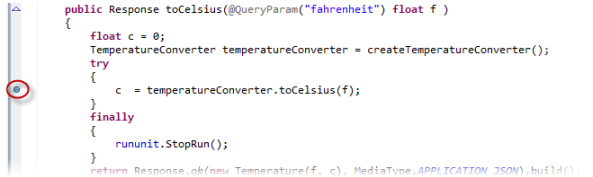
- Set a breakpoint in the Java code: The breakpoint is set.
-
Right-click
TemperatureConverterPrj, then choose
.
The Debug on Server dialog box appears.
-
Click
Finish.
If the server is not already running, it is started.
-
Navigate to the following URL:
http://localhost:8080/TemperatureConverterPrj/RestApp1/getCelsius?fahrenheit=212
-
If you are prompted to switch to the
Debug perspective, click
Yes.
The breakpoint is hit and execution breaks in the Java program. At this point, you can step through the program as normal.
-
Press
F8 to resume execution.
The compute breakpoint is hit and execution breaks in the JVM COBOL program.
- Continue debugging, or press Ctrl+F2 to terminate.