Debugging the Batch Application
Starting the server
If the enterprise server is not yet started, you need to start it as follows:
- Click the Server Explorer tab.
If the tab is not visible, click . Select and then click OK.
- In Server Explorer, right-click the Bankdemo server and then click
Start.
Wait until the server has started. In the list of servers in Server Explorer, BANKDEMO still has a red square next to it. This is a refresh delay.
Viewing the debug configurations
The project has two pre-configured debug configurations; a CICS Debug and a JCL Debug one, that you will use to debug the batch and the online application.
- In the Team Developer Tree view, select the BANKDEMO project and then select .
- In the left-hand pane of the Debug Configurations dialog expand COBOL Enterprise Server.
- Click CICS Debug.
- Click the different tabs in the right-hand pane to see what debug settings are enabled for this configuration. Note that this configuration will be used with the BANKDEMO server.
- Click JCL Debug under COBOL Enterprise Server.
- Click the different tabs in the right-hand pane to see what debug settings are enabled for this configuration.
- Click Close to close the Debug Configurations dialog without saving any changes.
Starting the debugger
You can now start the debugger. It starts in the background until a program which is debuggable is triggered. The demonstration application includes around 60 programs and just eight of them, the ones which are included in the project, are debuggable. To start the debugger:
- In the Team Developer Tree view, select the BANKDEMO project and then select from the menu bar.
- In the left-hand pane of the Debug Configurations dialog expand COBOL Enterprise Server.
- Click JCL Debug and then click Debug.
- You might receive a message about opening the Debug perspective when it launches. If you do, click
Yes.
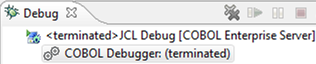
This opens a new Debug pane, saying it is waiting for attachment. In addition, in the top right of the main screen, the view has changed from Team Developer to Debug:
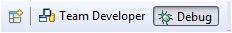 . You can switch between the
Debug and
Team Developerperspectives by clicking on the respective tab.
. You can switch between the
Debug and
Team Developerperspectives by clicking on the respective tab.
- Click the Team Developer tab for now.
- In Server Explorer, right-click the enterprise server and click
Refresh.
The application is now waiting for an event that will trigger the debugging.
You can now look at some simple features inside the debugger. To submit the JCL job:
- In the Team Developer Tree view, expand the JCL Files folder.
- Right-click ZBNKSTMT.jcl and click Submit JCL to associated Server.
- Depending on what you have done before, you may receive a message to
Confirm Perspective Switch. If you receive it, check
Remember my decision and click
Yes. If Eclipse does not switch to the Debug perspective automatically, click the
Debug button,
, in the right upper corner of the main Eclipse window to switch the perspective.
This starts the debugger and opens ZBNKEXT1.cbl for debugging, with the execution point set on the first line of Procedure Division.
The highlighted line of code is the one the IDE will execute next.
- Press
F5 to execute the line.
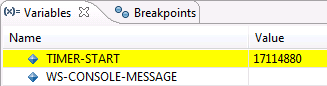
The PERFORM statement executes and takes you to the line starting with IF TIMER. You can also see that a Variables view is now open in the IDE showing the current value of a data item on the line of code which is about to be executed.
- Press F5 slowly a few more times until you reach line 18000. Watch the code as you step through it and notice how the values of the variables change inside the Variables view.
Looking at data values
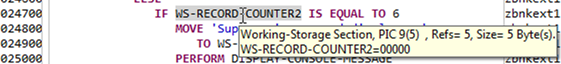
- Scroll to line 24700 of ZBNKEXT1.cbl.
- Hover the
WS-RECORD-COUNTER2 data item.
This provides you with details of the location, the size, the format, the number of times the field is used in the program, and the current value of the data item.
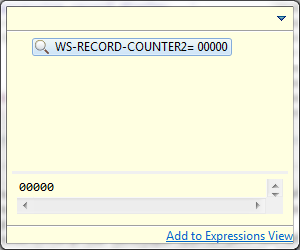
- To change the value of
WS-RECORD-COUNTER2, right-click the data item and click
Inspect COBOL.
This opens a pop-up window showing the value of the data item. Currently, it is 00000.
- Click
Add to Expressions View in the pop-up.
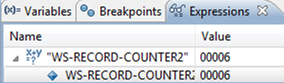
This opens the Expressions tabbed view and adds the data item to it.
- On the row for WS-RECORD-COUNTER2, click the arrow next to the data item to expand it.
- In the repeated version of the field name, change the value from 00000 to 00006.
Running CSI queries
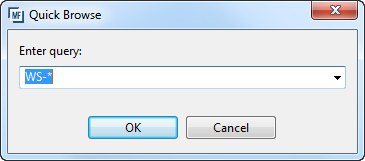
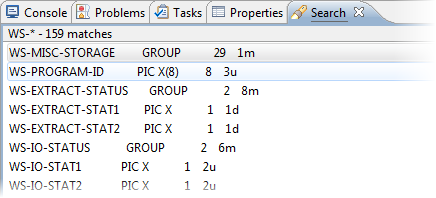
You can use the COBOL Source Information (CSI) functionality and its Quick Browse dialog to obtain information about your program when you are debugging it. This example shows details for data items starting WS-, such as the name, definition, and amount of times each item occurs in the program.
- Click the
Quick Browse button (
 ) on the toolbar to start the
Quick Browse dialog box.
) on the toolbar to start the
Quick Browse dialog box.
- Enter a simple query such as WS-*.
- Click
OK to run the query.
The results are shown in the Search view.
To see more examples of CSI queries, start the Quick Browse dialog box again and press F1 to open the product help.
Setting a simple breakpoint
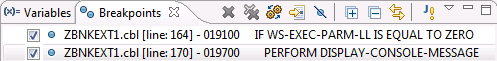
Check the Breakpoints view at the top right of the screen. Currently, there are no breakpoints set in the program. To set a simple breakpoint:
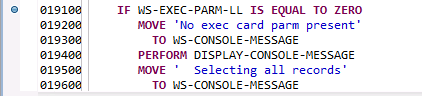
- Scroll down the code to line 019100.
- Double-click in the grey area to the left of this line or right-click in the same place and click Toggle Breakpoint.
- Do the same for line 019700.
- Use F5 to step through the code and F8 to execute it. Press F8 now.
- Press
F8 to resume the execution.
You can see that ZBNKEXT1.cbl finishes and the debugger starts to debug the second program defined in the JCL.
 , in the debugger toolbar.