Debugging the Online Application
Starting the server
If the enterprise server is not yet started, you should start it as follows:
- Click the Server Explorer tab in the bottom right pane of the IDE.
If the tab is not visible, click . Select Micro Focus COBOL > Server Explorer and then click OK.
- In Server Explorer, right-click the Bankdemo server and then click
Start.
Wait until the server has started. If in the list of servers in Server Explorer BANKDEMO still has a red square next to it, right-click it and click Refresh.
Starting the debugger
You can now start the debugger. It starts in the background until a program which is debuggable is triggered. The demonstration application includes around 60 programs and just eight of them, the ones which are included in the project, are debuggable. To start the debugger:
- In the Team Developer Tree view, select the BANKDEMO project and then select from the menu bar.
- In the left-hand pane of the Debug Configurations dialog box, expand COBOL Enterprise Server.
- Click CICS Debug and then click Debug.
- You might receive a message about opening the Debug perspective. Click
Yes.
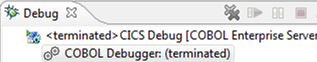
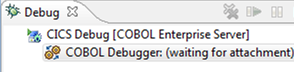
This opens a new Debug pane, showing the COBOL debugger that is waiting for an attachment:
In addition, in the top right corner of the main screen, the perspective has changed from Team Developer to Debug:
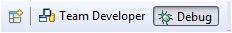 . You can click on these tabs to switch between the
Debug and
Team Developer perspectives.
. You can click on these tabs to switch between the
Debug and
Team Developer perspectives.
Your Eclipse application is now waiting for an event to happen that will trigger the debugging.
- In the toolbar, click the downward arrow next to the debug icon,
 .
.
You can see that the pre-configured CICS and JCL debug configurations have now appeared in the menu.
- In the Debug view, right-click the COBOL Debugger thread, and click Show Rumba Terminal.
- Click the
New Rumba Mainframe Display button,
 , in the toolbar of the Rumba Mainframe Display view.
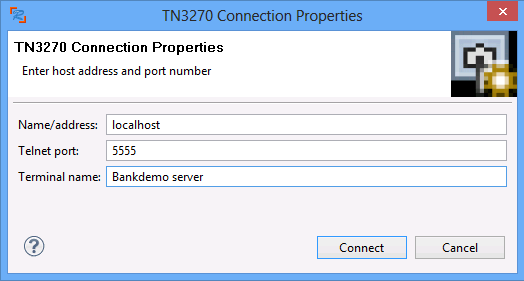
- Specify the host name and the TN3270 port number for the Bankdemo server as follows:
- Click
Connect.
This connects the display to the Bankdemo server and loads the start screen of the application.
- Press CTRL+SHIFT+Z to clear the screen of the emulator.
- Enter transaction id BANK and press Enter.
 , in the debugger toolbar to stop debugging.